A needle in a haystack: Why log growth without log hygiene poses a risk to IT platforms
Logs are one of the most important tools in IT operations. They aid troubleshooting, support security analyses, provide clues to performance issues and, in many cases, form the basis for audits, compliance and service-level verification. However, particularly in modern Kubernetes environments, the volume of this data is growing at an enormous rate. Every service, every container, every middleware component and every infrastructure module continuously generates events. What initially sounds like greater transparency can, in practice, quickly lead to the opposite: the larger the mountain of data becomes, the more difficult it is to identify the relevant signals.
This is precisely where the challenge arose in the operation of our partner RISE’s telematics services. It is a challenge faced by many operators of large logging platforms. More logs do not automatically mean better observability. Initially, they mean more data, more indexing effort, more storage requirements, more search load and more attention that must be devoted by humans or automated systems. Without clear log hygiene, sensible retention strategies and effective platform controls, a valuable database turns into an ever-growing haystack in which the actual needle becomes harder to find.
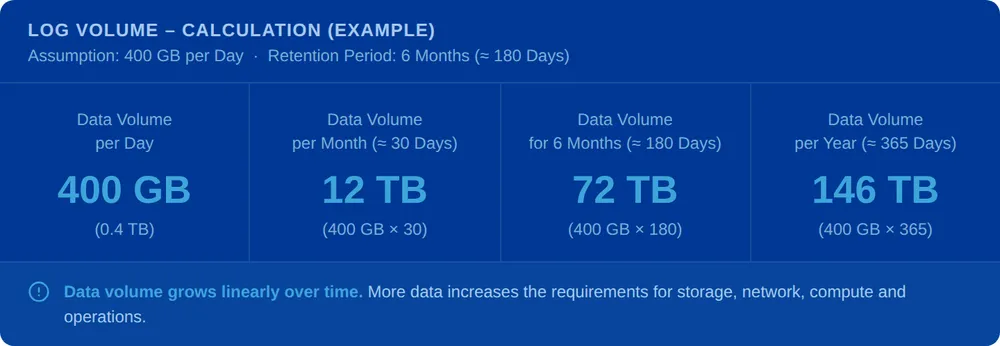
Here, we describe this issue using the example of our partner RISE’s multi-tenant logging platform for Kubernetes environments, and outline the technical, organisational and operational measures we have put in place to extract actionable insights (signals) from growing volumes of log data.
The problem: More volume does not mean more insight
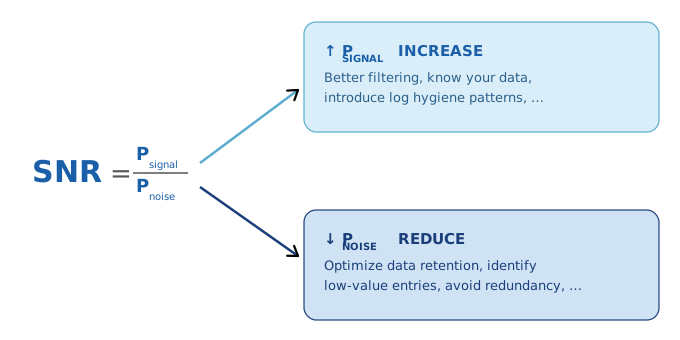
The central misconception underlying many logging strategies is that log data is viewed primarily as a volume issue. The assumption is that if more data is available, then more knowledge about the system must also be available. In reality, however, it is not the sheer volume of data that is decisive, but the ratio of signal to noise.
A signal is a piece of information that provides a relevant statement about the state of a system. It may indicate an error, a security breach, a performance degradation or a business-critical impact.
Noise, on the other hand, consists of irrelevant, redundant, repetitive or non-actionable information. The higher the proportion of noise, the lower the operational value of the entire log database.
In large Kubernetes and cloud-native environments, this ratio can quickly become skewed. Debug logs remain accidentally active in production. Third-party components write very detailed standard logs. Retry loops generate new entries for every failed attempt. Structured logging results in many fields being indexed that nobody subsequently queries. At the same time, warnings and errors are often used excessively, meaning that log levels lose their significance as filter criteria. In the worst-case scenario, tickets are even generated automatically on the basis of log alerts for a service desk that is particularly reliant on a very high signal-to-noise ratio.
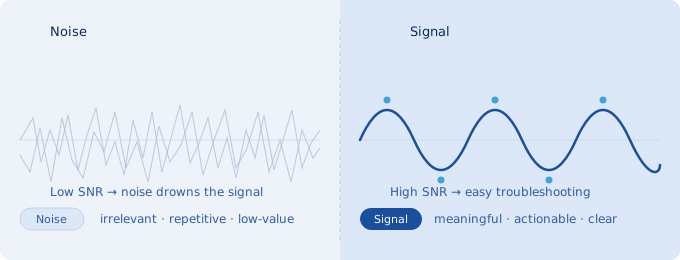
The result, however, is a declining signal-to-noise ratio. Whilst the platform contains ever-increasing amounts of data, the search for operationally relevant information becomes slower, more expensive and more prone to errors.
Log growth affects all levels of the platform
Excessive logging is not just a question of storage costs. In a centralised logging platform, costs and risks arise throughout the entire processing chain.
Even at the ingestion stage, large volumes of data must be received, buffered and distributed to tenant-specific processing pipelines. High load peaks place a strain on network, disk I/O, CPU and buffer capacities. Further overheads are added during the parsing phase: JSON parsing, regular expressions, timestamp normalisation, filtering, enrichment and mapping to a uniform schema such as ECS all require processing time.
This effect is exacerbated during indexing. Each indexed field generates additional index structures. The more fields there are, the higher the cardinality and the greater the volume, the greater the strain on the CPU, RAM and heap. In the storage layer, additional costs arise from replication, high availability, geographical redundancy and varying retention requirements. Finally, dashboards, alerts, security monitoring, ad hoc searches and machine learning jobs in the search layer all compete for the same resources.
Log growth therefore does not hit a single bottleneck, but affects the entire platform architecture. This is precisely why simply provisioning more hardware is not enough. Scaling can only alleviate the symptoms, but does not solve the structural problem of a poor signal-to-noise ratio.
When the platform comes under pressure
When a logging platform comes under load, the effects manifest in several ways. One particularly critical consequence is log delay.

Logs no longer appear in the search indices in real time, but with a delay. Whilst this may be inconvenient for standard analyses, it can become problematic for alerting. If alerts check a time window that technically already exists but has not yet been fully populated with data, relevant events may be overlooked or detected late.
A second effect is storage pressure.

If storage, IOPS or replication reach their limits, the backlog can propagate throughout the entire pipeline. Delays in writing lead to ingest backlogs, which in turn increase the pressure on buffers and processing components. In the worst-case scenario, this can result in unstable cluster states or risks of data loss.
A third effect relates to search. Ingest and search often share the same infrastructure.

A resource-intensive query by one tenant can therefore affect other tenants. This so-called noisy neighbour problem is one of the key challenges facing multi-tenant logging platforms.
Multi-tenancy is a deliberate compromise
Complete isolation of each tenant would be technically possible, but not always practical. In our experience, dedicated clusters per tenant increase governance overhead, operational complexity and costs. Fully shared platforms, on the other hand, require effective mechanisms for fairness, transparency and risk mitigation.
The most sensible architecture therefore usually lies between these extremes. For particularly sensitive, regulated or SLA-critical use cases, a dedicated environment may be required. These include, for example, security-relevant data, audit logs, personal information or workloads with specific availability requirements. For many other use cases, a shared platform makes more economic and operational sense, provided it is safeguarded by quotas, retention models, monitoring and clear governance rules.
We have introduced a deliberate decision-making model here: When should a tenant be isolated? When is logical separation sufficient? Which data types have which retention requirements? Which workloads generate high ingest rates or search loads? Which failure modes are acceptable, and which are not? Only once these questions have been systematically answered can multi-tenancy be operated in a controlled manner.
The question remains as to what to do if one already has a poor signal-to-noise ratio.
Regaining the signal: transparency, awareness and standardisation
In our experience, restoring a good signal-to-noise ratio (SNR) is not a one-off project, but a continuous process. In heterogeneous system landscapes, there are many components, teams, log formats, retention requirements and operating models. This is why a combination of technical platform features and organisational log hygiene is required.
The first building block is transparency. Teams need to be able to see how much data they are generating, which indices are growing, which sources are generating particularly high volumes, and to what extent they are utilising their quotas. Without this transparency, log growth remains an abstract concept. Only once their own footprint is visible can teams take targeted action.
Here, we rely on the well-known ‘T-shirt sizes’ model. Tenants order their log storage space based on one of these sizes:
| T-Shirt Size | Total Storage |
|---|---|
| 3XL | 15,000 GB |
| 2XL | 10,000 GB |
| XL | 5,000 GB |
| L | 2,000 GB |
| M | 500 GB |
| S | 100 GB |
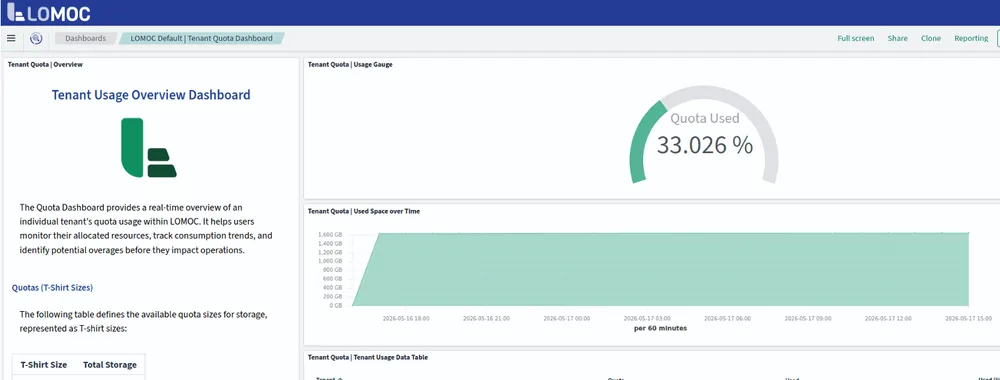
To support their capacity management, each tenant is also automatically provided with a dashboard showing their current consumption and consumption trends over time.
The second building block is Awareness. Developers and operations teams must understand that logging is not free. Every log line consumes resources. Every piece of unnecessary information makes it harder to find relevant events. Any debug output that remains active indefinitely can have a massive impact in large environments.
The third building block is standardisation. Platform operators should not solve recurring problems on a project-by-project basis, but rather provide common patterns: standardised retention tiers, naming conventions, dashboards, quota models, onboarding processes and recommendations for structured logs. This creates a common operational model that makes scaling manageable.
Platform controls: quotas, retention, isolation and support
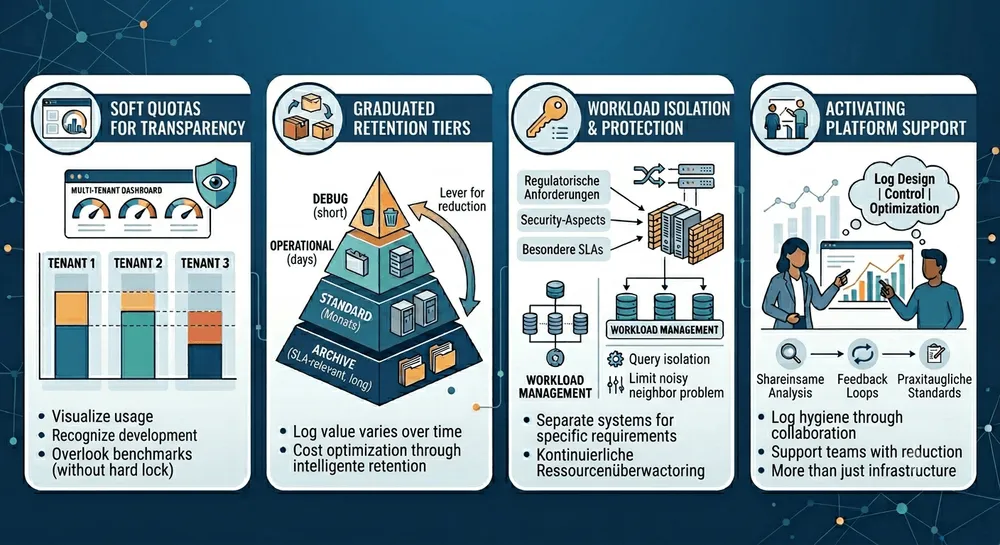
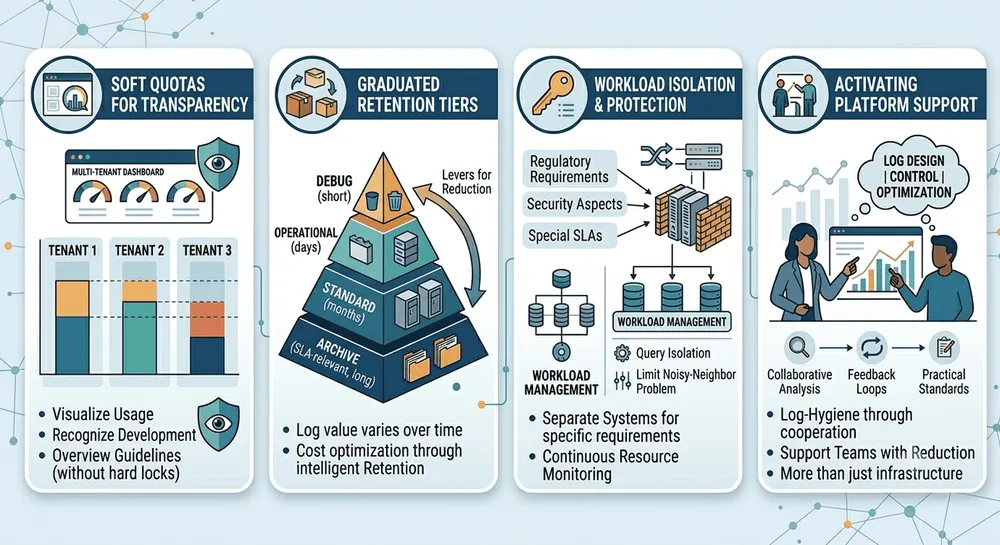
A modern logging platform requires technical control mechanisms that not only capture data but also enable active control over its use. A key approach is soft quotas per tenant. These are not primarily intended for strict enforcement, but rather for transparency. Teams can see how much volume they are generating, how their usage is developing, and when agreed benchmarks are exceeded.
Retention is usually the most effective lever for reducing data volume. Not all logs retain the same value over the same period. Data relevant to audits and SLAs may remain relevant for months. Transient operational errors are often only valuable for a matter of hours or a few days. Debug information should ideally be stored permanently only for a very short time, or not at all. Tiered retention levels are therefore advisable, for example for temporary, short-lived, standard and archived data.
Isolation also remains a key component. Not every workload belongs on the same shared infrastructure. Where regulatory requirements, security considerations or specific SLA commitments dictate, separate systems are advisable. Where infrastructure is shared, tenant-specific resource usage must be continuously monitored. Workload management functions, such as query-layer isolation, can also help to mitigate the ‘noisy neighbour’ problem.
The fourth building block is support. Platform teams should not only provision infrastructure, but also support teams with log design, retention strategies, the reduction of unnecessary data and onboarding. Good log hygiene rarely results from guidelines alone. It arises from feedback, joint analysis and practical standards.
Producer Hygiene: Good logs start at the source
As important as platform controls are, a large part of the signal quality is determined right at the point where logs are generated. Applications and services should not treat logs as unstructured by-products, but rather as a deliberately designed interface between software and operations.
A first step is the design of high-quality log types. Log levels and categories should be used consistently. Where possible, errors should be assigned stable error codes. Performance logs should be rich in information and contain relevant metrics such as latency, throughput, status code, request size or error class. Field names should follow established schemas so that data remains comparable and queryable across systems.
A particularly effective pattern is conditional logging. Instead of logging every successful request in detail, detailed logs are only generated when certain conditions are met: a response time exceeds a threshold, an HTTP 5xx error occurs, a retry limit is exceeded, or a security-related event is detected. This principle has been used in database systems for years, for example in the form of slow query logs. It drastically reduces log volume without losing relevant diagnostic data.
On-demand logging is suitable for particularly data-intensive debug information. TLS details, complete request/response dumps or in-depth trace information should not be permanently enabled, but should be able to be switched on as required via runtime toggles. By default, they remain disabled; in the event of an incident, they are made available on a targeted basis.
Finally, retention should always be determined by the use case. Not every log source requires the same retention period. Transient operational data quickly loses its value. Audit data or SLA evidence may remain relevant for longer. Those who fail to make this distinction will, in the long term, end up paying for data that is of little operational use.
The Way Forward: From Transparency to Active Management
The next step in the development of modern logging platforms lies in a stronger integration of transparency, automation and governance. Quota dashboards show which tenants are using which resources. T-shirt sizing models can help to communicate log budgets clearly and simplify capacity planning. Automated notifications when quotas are exceeded provide early feedback before technical bottlenecks arise.
At the same time, workload management functions are becoming increasingly important. Query-level isolation can prevent individual, particularly costly queries from impacting the performance of other tenants. In the future, such concepts can also be extended to ingest workloads. This shifts the operating model from purely ‘best-effort’ usage towards controlled, traceable and fair resource utilisation.
At the same time, log volume reduction remains an ongoing task. Platform-side filters, improved defaults, the detection of low-value patterns and tenant-specific feedback help to reduce unnecessary data at an early stage. However, the real impact only materialises through collaboration with the teams that produce the logs.
Conclusion: It is not the haystack that is the problem, but how it is organised
The metaphor of the needle in a haystack is catchy, but only partly correct. Modern log data is not entirely unstructured. It contains timestamps, fields, categories, sources, indices and metadata. The real problem is therefore not just the size of the haystack, but the quality of the organisation system.
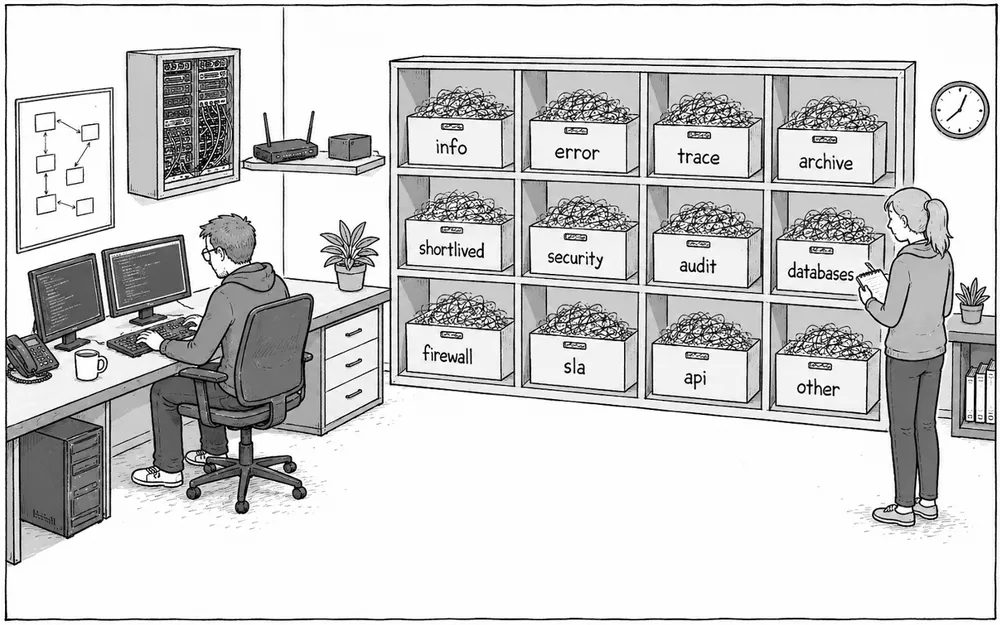
A high-performance logging platform must do more than simply collect data and make it searchable. It must help separate the signal from the noise. It must reveal who is consuming which resources. It must enable control over retention, quotas and isolation. And it must support teams in producing better logs.
For Kubernetes and cloud-native environments, this is not an optional optimisation, but a prerequisite for stable operation. After all, the larger the platform becomes, the more log hygiene determines whether logs will help in the event of an incident — or become part of the problem themselves.
Interested in this topic? – Get in touch – we’d be happy to help!
Get in touch